Retaining Persons with Disabilities in the Federal Workforce
Download a PDF version of this document.
Table of Contents
The State of PWD Retention in the Federal Sector
How to Improve EEO and Retention for PWD
Descriptive Overview of the Data
Promising Practices to Retain PWD: Regression Results
Appendix A: Descriptive Statistics
Appendix B: Regression Results for Part G Practices
Executive Summary
By law, Federal agencies are required to take steps to improve the retention of persons with disabilities.[1] Previous research from the U.S. Equal Employment Opportunity Commission (EEOC) established that persons with disabilities (PWD) have lower retention rates in the Federal sector than persons without disabilities (PWOD).[2] However, limited research has empirically identified promising practices to improve equal employment opportunities (EEO) and retention for PWD.
In this report, EEOC researchers used three years of data from EEOC Management Directive 715 (MD-715) Reports. The analysis examined the relationship between PWD retention in fiscal year (FY) 2020 and 156 practices required for Federal agencies to have model EEO programs. By examining a wide number of practices, the EEOC aimed to identify the practices that are most promising for improving PWD retention.
Main Findings
This report found that four variables were significantly associated with fewer voluntary separations of PWD at Federal agencies in FY 2020:
- Having established disability reasonable accommodation (RA) procedures that comply with the EEOC’s regulations and guidance as of FY 2020.
- Posting procedures for processing requests for personal assistance services (PAS)[3] on the agency’s public website as of FY 2019.
- Having established procedures for processing requests for PAS that comply with EEOC's regulations, enforcement guidance, and other applicable executive orders, guidance, and standards as of FY 2020.
- Posting procedures for processing PAS requests on the agency’s public website as of FY 2020.
These findings support EEOC regulations that define compliant RA procedures. The findings also support the EEOC’s 2017 final rule, Affirmative Action for Individuals with Disabilities in the Federal Government, which requires Federal agencies to provide PAS to eligible persons with disabilities.
Main Recommendations
Based on these findings, the EEOC recommends that agencies ensure they have:
- Established compliant RA procedures.
- Established compliant procedures for processing PAS requests.
- Procedures for processing PAS requests publicized to their employees and applicants on their public website.
Future research should use similar methods to identify promising practices for improving EEO for persons in other protected categories and for other employment outcomes. The results of such research should be considered in any updates to the requirements for a model EEO program found in MD-715. The EEOC will continue to identify and promote promising practices to help employers create more equitable workplaces.
Introduction
Legal Background
For about five decades, Section 501 of the Rehabilitation Act of 1973 has protected persons with disabilities (PWD) from discrimination in Federal sector employment. The Rehabilitation Act also ensures that the Federal Government implements affirmative action plans and policies within their offices for PWD. By implementing these measures, the Federal Government strives to be a model employer.[4] The Rehabilitation Act of 1973 also allows the U.S. Equal Employment Opportunity Commission (EEOC) to issue “such rules, regulations, orders and instructions as it deems necessary and appropriate” to carry out its Federal sector equal employment opportunity (EEO) responsibilities.[5]
Initially, the Rehabilitation Act only focused on “hiring, placement, and advancement.”[6] More recently, retaining persons with disabilities has become a priority. In 2010, President Obama signed Executive Order 13548 establishing that Federal agencies must be model employers and improve the retention of persons with disabilities.[7]
Furthermore, in 2017, the EEOC issued a final rule, Affirmative Action for Individuals with Disabilities in the Federal Government. That final rule strengthened regulations to enhance the recruitment, hiring, advancement, and retention of qualified individuals with disabilities in the Federal Government. The rule requires Federal agencies to strengthen reasonable accommodation programs, ensure accessibility, and provide personal assistance services (PAS) for eligible persons with disabilities. It also requires Federal agencies to set a goal of having 12 percent of their workforces be PWD.[8] These requirements aim to enhance EEO for PWD in the Federal sector.
The State of PWD Retention in the Federal Sector
With the added focus on the retention of PWD in the Federal Government, it is important to understand the current state of PWD retention and to identify ways to improve retention. However, the EEOC could only find limited research that examined the retention of PWD in the Federal Government. For example, one study used Federal Employee Viewpoint Survey (FEVS) data to account for disability status while measuring the relationship between turnover intentions and five inclusive organizational practices. The practices evaluated were fairness, openness to diversity, cooperativeness, supportiveness, and employee empowerment. The results suggested that only fairness mitigated the negative relationship between disability and turnover intentions.[9]
The U.S. Government Accountability Office (GAO) has also evaluated retention rates of PWD. Using 2011-2017 data, the GAO data showed that the retention rates of PWD and persons without disabilities (PWOD) were similar two years after hiring. After five years, the difference between PWD and PWOD retention was only a difference of 0.6 percentage points. Still, the GAO continued to find the low retention rate of PWD problematic.[10]
Lastly, in a recent report, The EEO Status of Workers with Disabilities in the Federal Sector, the EEOC evaluated 5-year trends of separations from Federal employment by disability status (targeted disability, any disability, and no disability). Persons with targeted disabilities (PWTD) had the highest voluntary separation rate, followed by PWD and PWOD. The data used in that report defined voluntary separations as those resulting from resignation, retirement, and death (employee loss of life). In FY 2018, the voluntary separation rates were about 8.8 percent for PWTD, 8.1 percent for PWD, and 6.5 percent for PWOD. In other words, on average, PWD were 27 percent more likely to separate than PWOD, while PWTD were 37 percent more likely to separate than PWOD.
Involuntary separations showed a similar pattern. Involuntary separations include disciplinary removals, terminations due to lack of funds, and resignations and retirements in lieu of disciplinary removal or termination. PWTD were more than twice as likely to involuntarily separate compared to PWOD, while PWD were 53 percent more likely to involuntarily separate compared to PWOD.[11]
How to Improve EEO and Retention for PWD
In the early 2010s, the GAO published research on ways to increase the participation of PWD in the Federal workforce. They used focus group data. In two separate reports, the GAO identified eight practices that could be beneficial in increasing the participation of PWD:
- Top leadership commitment.
- Accountability, including goals to help guide and sustain efforts.
- Regular surveying of the workforce on disability issues.
- Better coordination within and across agencies.
- Training for staff at all levels to disseminate leading practices throughout the agency.
- Career development opportunities inclusive of PWD.
- A flexible work environment.
- Centralized funding at the agency level for reasonable accommodations.[12]
Furthermore, researchers at Cornell University evaluated Federal agency practices to determine how they affected employment outcomes of PWD. Out of the nine practices and policies studied, the researchers identified three effective practices:
- Sufficient staffing and budget for the EEO programs.
- Trend analysis, such as by race, gender, role, or compensation.
- Direct supervision of the EEO director by the agency head.[13]
Based on the research summarized above, additional research on the retention of PWD in the Federal sector is needed. In this report, the EEOC aims to identify the specific practices out of all practices on the MD-715 Essential Elements Self-Assessment Checklist (Part G) that are most associated with retention of Federal persons with disabilities. Federal agencies struggling with PWD retention should prioritize implementing the potentially promising practices found in this report.
Purpose of This Report
This report was conducted in response to the EEOC’s January 2017 final rule, Affirmative Actions for Individuals with Disabilities in the Federal Government. As noted above, that final rule strengthened regulations to enhance the participation, advancement, and retention of qualified PWD in the Federal government.[14] Previous EEOC research found that PWD voluntarily separated from Federal employment at a higher rate than PWOD.[15]
This current report examines all the questions in the EEOC MD-715 Essential Elements Self-Assessment Checklist (Part G) to identify the practices that are most related to retaining PWD in the Federal workforce. This includes examining 156 individual practices over three years to identify the practices that were most strongly and positively associated with PWD retention.
Identifying the most promising practices for the retention of PWD in the Federal sector is useful for several reasons. First, the EEOC will be better equipped to help fellow Federal agencies and other organizations to retain PWD by providing specific practices with proven track records. Secondly, with empirical backing, the EEOC may be more effective in enforcing compliance with its regulations. In addition, the promising practices found here may improve equity for PWD beyond the Federal sector.
Methodology
This report examines the research question, “What promising practices found on the MD-715 Part G Agency Self-Assessment Checklist are most associated with the retention of PWD?” To answer this question, the EEOC used statistical analysis and data from Federal Agency Annual EEO Program Status Reports, also known as MD-715 Reports.
Data
Annually, Federal agencies file MD-715 Reports with the EEOC. This study used workforce data on disability status[16] from fiscal year (FY) 2020 MD-715 Reports and data from the MD-715 Part G Agency Self-Assessment Checklist from FY 2018 to FY 2020.[17]
The outcome variable of interest was the number of voluntary separations of PWD from the permanent workforce at each agency in FY 2020. Voluntary separations include separations resulting from resignation and retirement. A higher number of voluntary separations indicates worse retention.
From the same data table, the EEOC obtained the number of PWD in each agency’s permanent workforce and the voluntary separation rate of PWOD[18] as these measures are likely to be directly related to the number of PWD voluntary separations.
The EEOC also used data from Part G of the MD-715 Report, which is the Agency Self-Assessment Checklist. Part G helps Federal sector EEO Directors to identify and highlight deficiencies in their EEO program that the agency must address to comply with MD-715 requirements. MD-715 requires that Federal agencies have model Title VII and Rehabilitation Act programs. These requirements include:
- Demonstrated commitment from agency leadership.
- Integration of EEO into the agency's strategic mission.
- Management and program accountability.
- Proactive prevention of unlawful discrimination.
- Efficiency.
- Responsiveness and legal compliance.[19]
Each year, Federal agencies answer 156 questions to assess whether each agency has the essential elements of an EEO program. “Yes” responses to the questions indicate that the agency is meeting the requirements of a model EEO program. “No” responses indicate that the agency has an EEO program deficiency. The EEOC treated “Not Applicable” responses in the same way as “No” responses.
The EEOC hypothesized that “Yes” responses to individual Part G questions (the explanatory variables) would be associated with fewer voluntary separations of PWD. The relationships between voluntary separations and individual Part G questions were examined one year at a time for FY 2018, FY 2019, and FY 2020.[20] It was important to use more than one year of Part G data because agencies that have only recently implemented promising EEO policies, procedures, and practices may not yet be seeing the positive effects on PWD retention.
The data only included Federal agencies that certified MD-715 Reports in FY 2020. When examining Part G questions from FY 2018 or FY 2019, the data only included agencies that certified the MD-715 Report for the respective year and FY 2020. Part G questions were excluded from the analysis if fewer than five agencies responded “No” or “Not Applicable.” In addition, the data only included agencies with at least one voluntary separation from the entire permanent workforce in FY 2020. Agencies were excluded from the analyses if they had more than 1,000 PWD voluntary separations or had a PWOD voluntary separation rate greater than 40 percent in FY 2020.[21] To keep as many observations (agencies) as possible, subcomponents of larger agencies (e.g., cabinet agencies) were used when available.[22]
Methodology
This report used a statistical analysis called negative binomial regression.[23] In general, a regression calculates the association between the outcome variable and each explanatory variable when all other explanatory variables are held constant. The results include coefficients that quantify the strength and direction of the relationship between the outcome variable and the corresponding explanatory variable.
In this report, the outcome variable was the number of PWD voluntary separations. The explanatory variable of interest was a single Part G question for a single year. Separate regressions were conducted for each Part G question by year. The voluntary separation rate of PWOD was included as an independent control variable, as it is likely that agencies with high separations of PWOD also have high separations of PWD.
The number of PWD in each agency’s permanent workforce directly affects the number of PWD voluntary separations. To have any number of PWD voluntary separations, there must have been at least that many PWD. Therefore, the number of PWD in the permanent workforce was included as an exposure variable that ensures that the results accounted for the number of chances that a PWD could have separated.
The specific type of regression used here, negative binomial regression, was chosen because the outcome variable is a count variable[24] and over-dispersed.[25]
For each Part G question for each year (FY 2018–20), a negative binomial regression was run. If the Part G question had a negative and statistically significant coefficient,[26] it meant that on average there were fewer voluntary separations of PWD at agencies that answered “Yes,” accounting for the number of PWD and the voluntary separation rate of PWOD. The practices associated with Part G questions with negative and statistically significant coefficients may be considered promising practices for PWD retention.
To better interpret the regression results, the predicted number of PWD voluntary separations are reported by whether the agency answered “Yes” or “No” to the Part G question. These predictions account for the number of PWD and the PWOD voluntary separations rate.
Average marginal effects, or the percent difference in the predicted number of PWD voluntary separations if the practice is in place, are also reported. If an average marginal effect is negative, having the practice in place is associated with fewer PWD voluntary separations.
Results
Descriptive Overview of the Data
Number of PWD Voluntary Separations
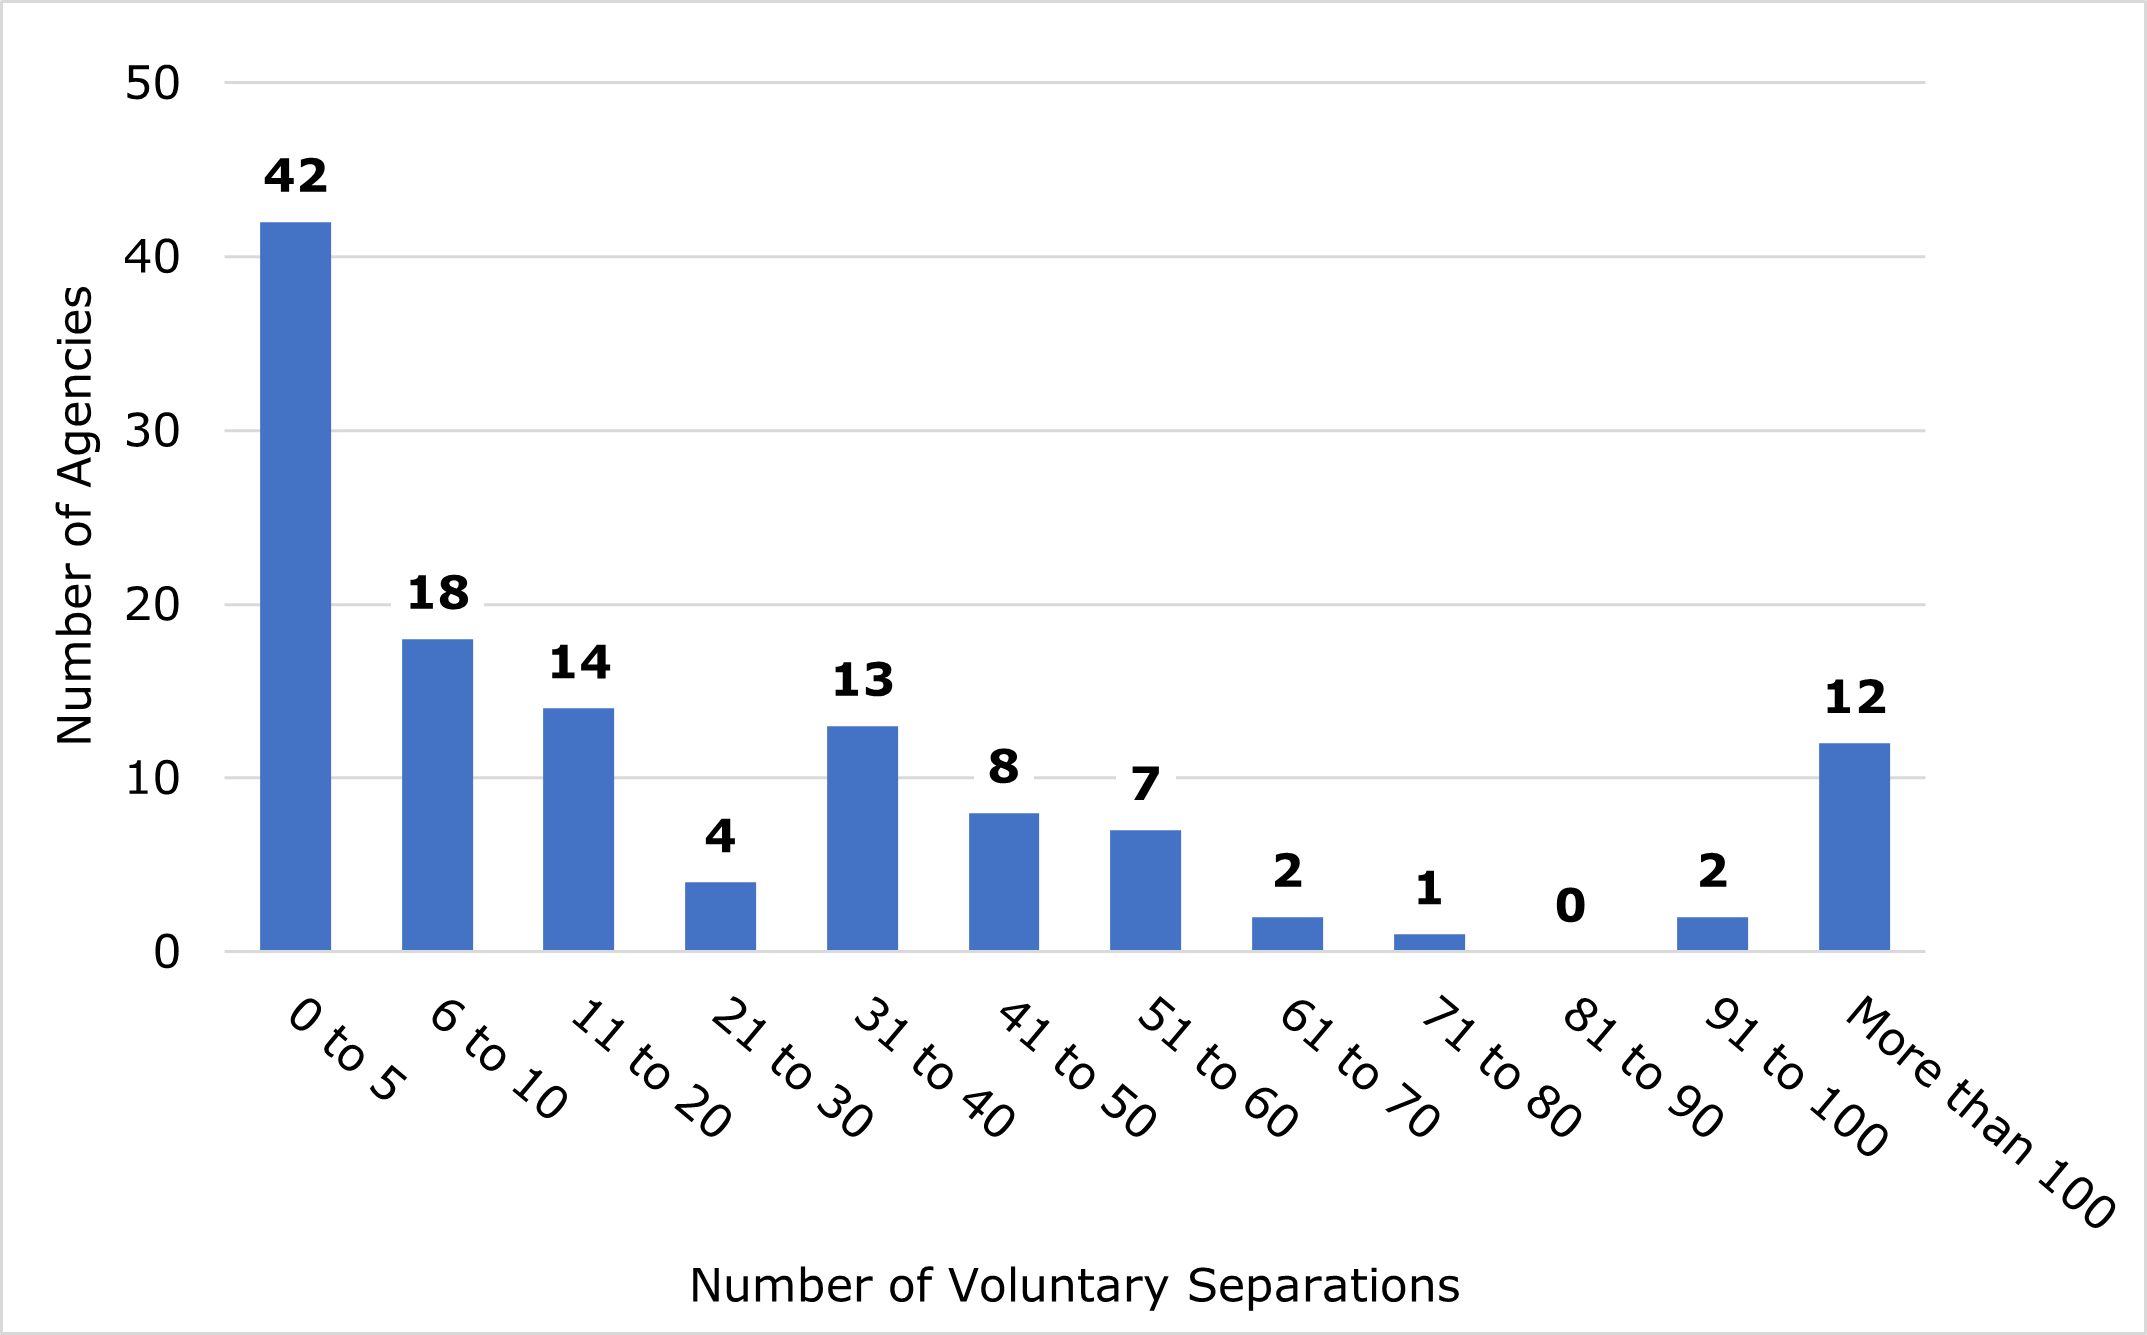
The median[27] agency in the dataset had 13 PWD voluntary separations in FY 2020. At the average agency, 41 PWD voluntarily separated. However, this value varied in part because the agency sizes varied. Figure 1 and Table 2 in Appendix A show that, at 42 out of the 123 agencies, there were five or less PWD voluntary separations. Only 11 agencies had no PWD voluntary separations, while 21 agencies had one or two PWD voluntary separations. In contrast, at 12 large agencies,[28] there were more than 100 PWD voluntary separations.
Figure 1. Voluntary Separations of Persons with Disabilities at Federal Agencies, FY 2020
| Voluntary Separations | Number of Agencies |
|---|---|
| 0 to 5 | 42 |
| 6 to 10 | 18 |
| 11 to 20 | 14 |
| 21 to 30 | 4 |
| 31 to 40 | 13 |
| 41 to 50 | 8 |
| 51 to 60 | 7 |
| 61 to 70 | 2 |
| 71 to 80 | 1 |
| 81 to 90 | 0 |
| 91 to 100 | 2 |
| More than 100 | 12 |
Notes: Data only include permanent employees. Voluntary separations include separations resulting from resignation and retirement.
Source: U.S. Equal Employment Opportunity Commission, FY 2020 Management Directive 715, Workforce Table B1.
Number of PWD
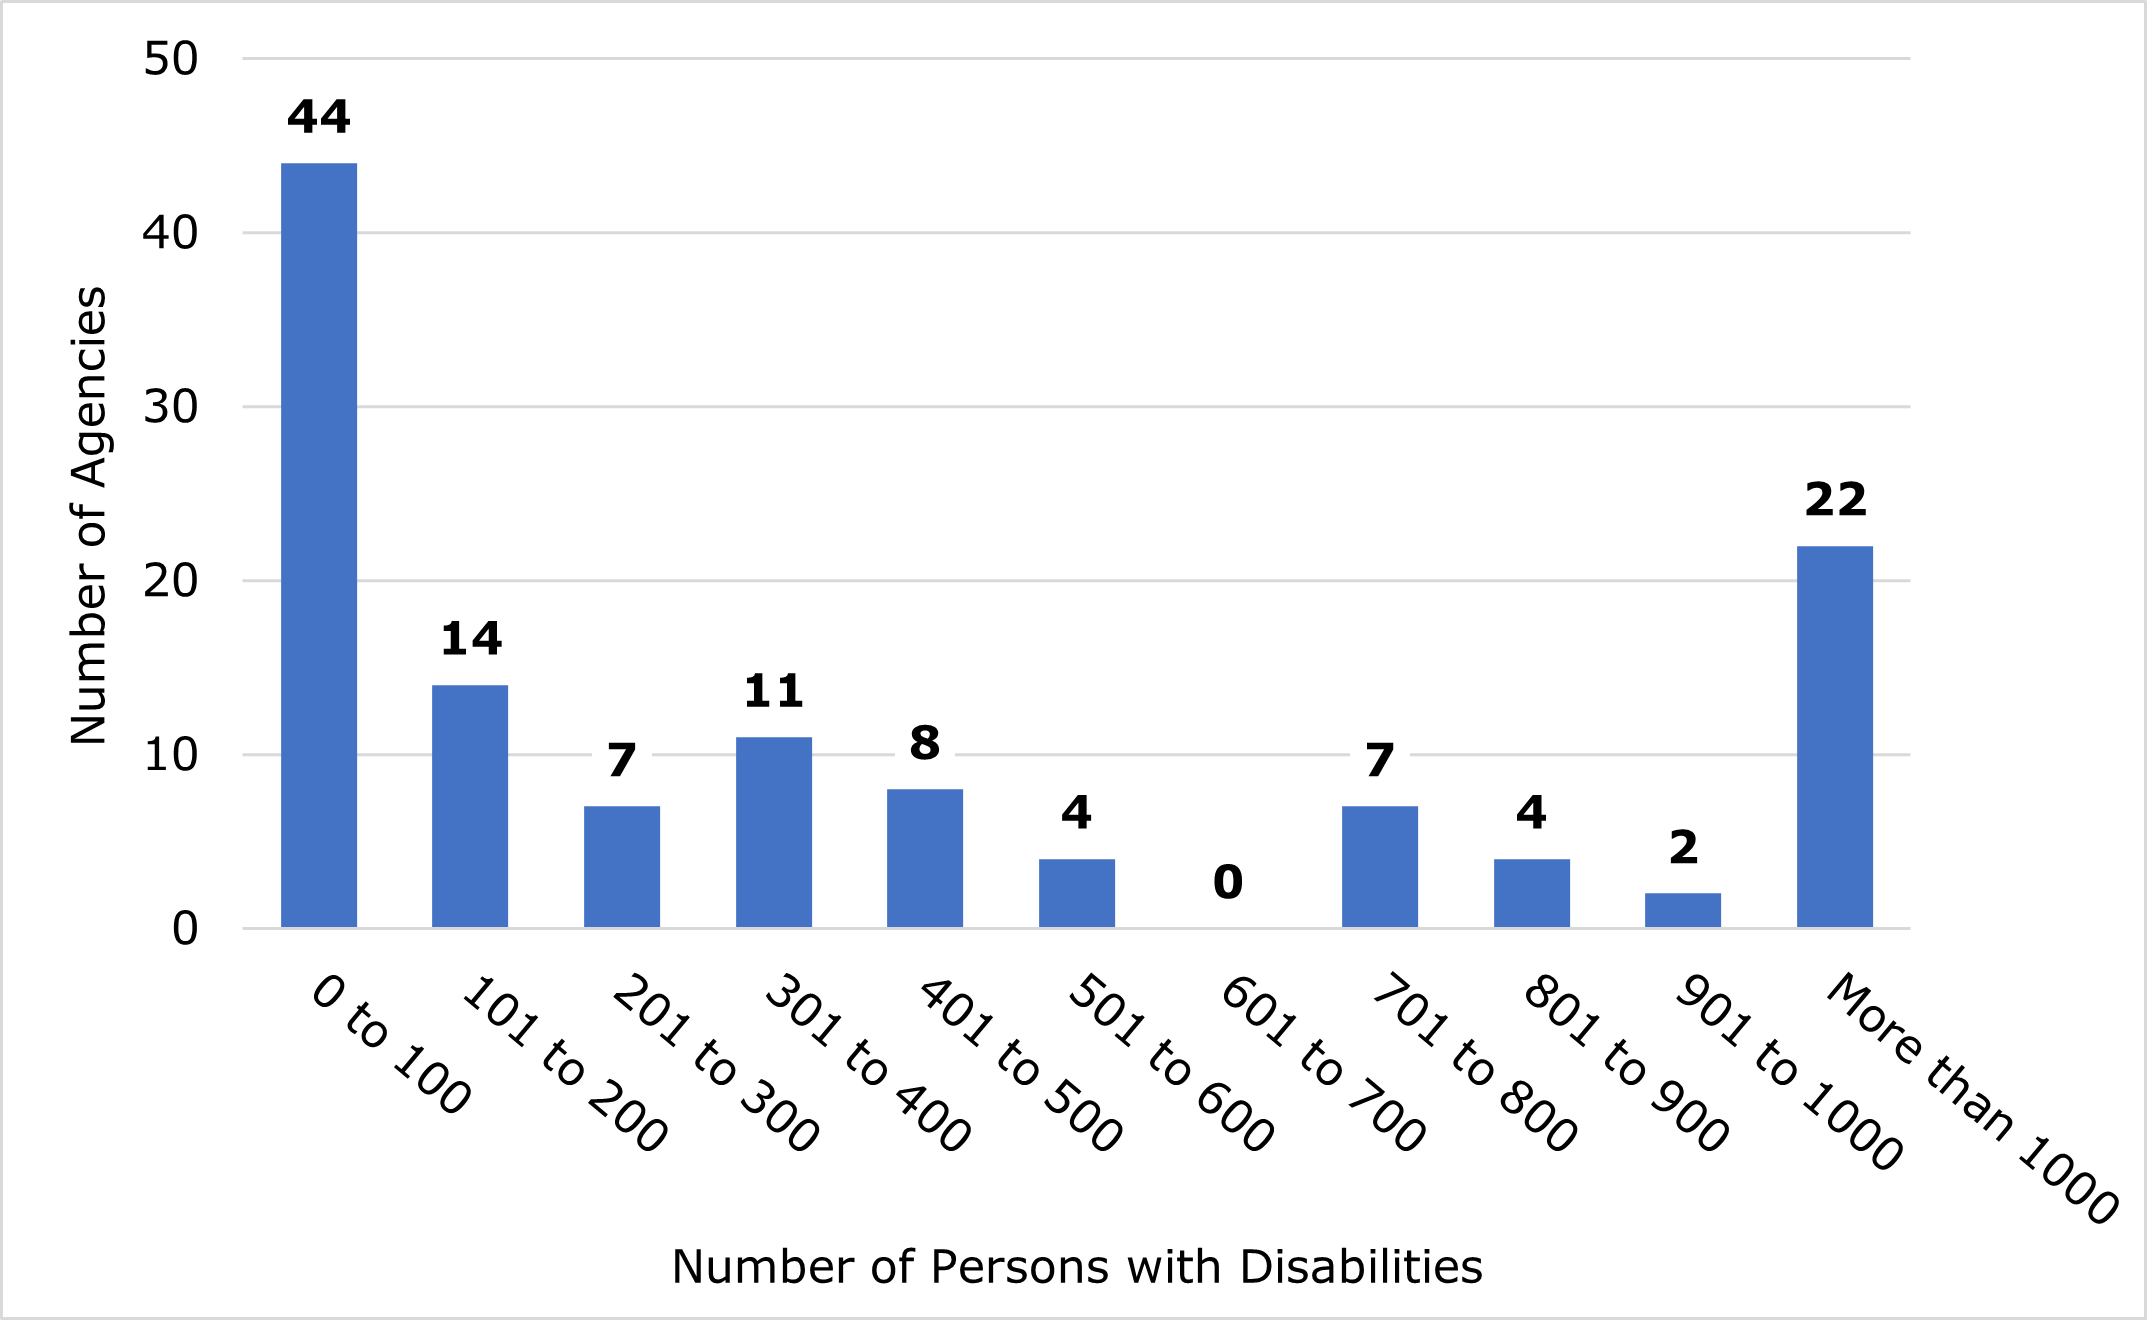
The median agency had 234 PWD in the permanent workforce. At the average agency, there were 704 PWD in the permanent workforce. Again, this varied with agency size. Figure 2 and Table 3 in Appendix A show that at 44 out of 123 agencies, there were 100 or less PWD—but 35 of those agencies had less than 1,000 permanent employees. At four agencies, there were less than 10 PWD. In contrast, at 22 large agencies,[29] there were more than 1,000 PWD.
Figure 2. Persons with Disabilities at Federal Agencies, FY 2020
| Number of Persons with Disabilities | Number of Agencies |
|---|---|
| 0 to 100 | 44 |
| 101 to 200 | 14 |
| 201 to 300 | 7 |
| 301 to 400 | 11 |
| 401 to 500 | 8 |
| 501 to 600 | 4 |
| 601 to 700 | 0 |
| 701 to 800 | 7 |
| 801 to 900 | 4 |
| 901 to 1000 | 2 |
| More than 1000 | 22 |
Note: Data only include permanent employees.
Source: U.S. Equal Employment Opportunity Commission, FY 2020 Management Directive 715, Workforce Table B1.
PWOD Separation Rates
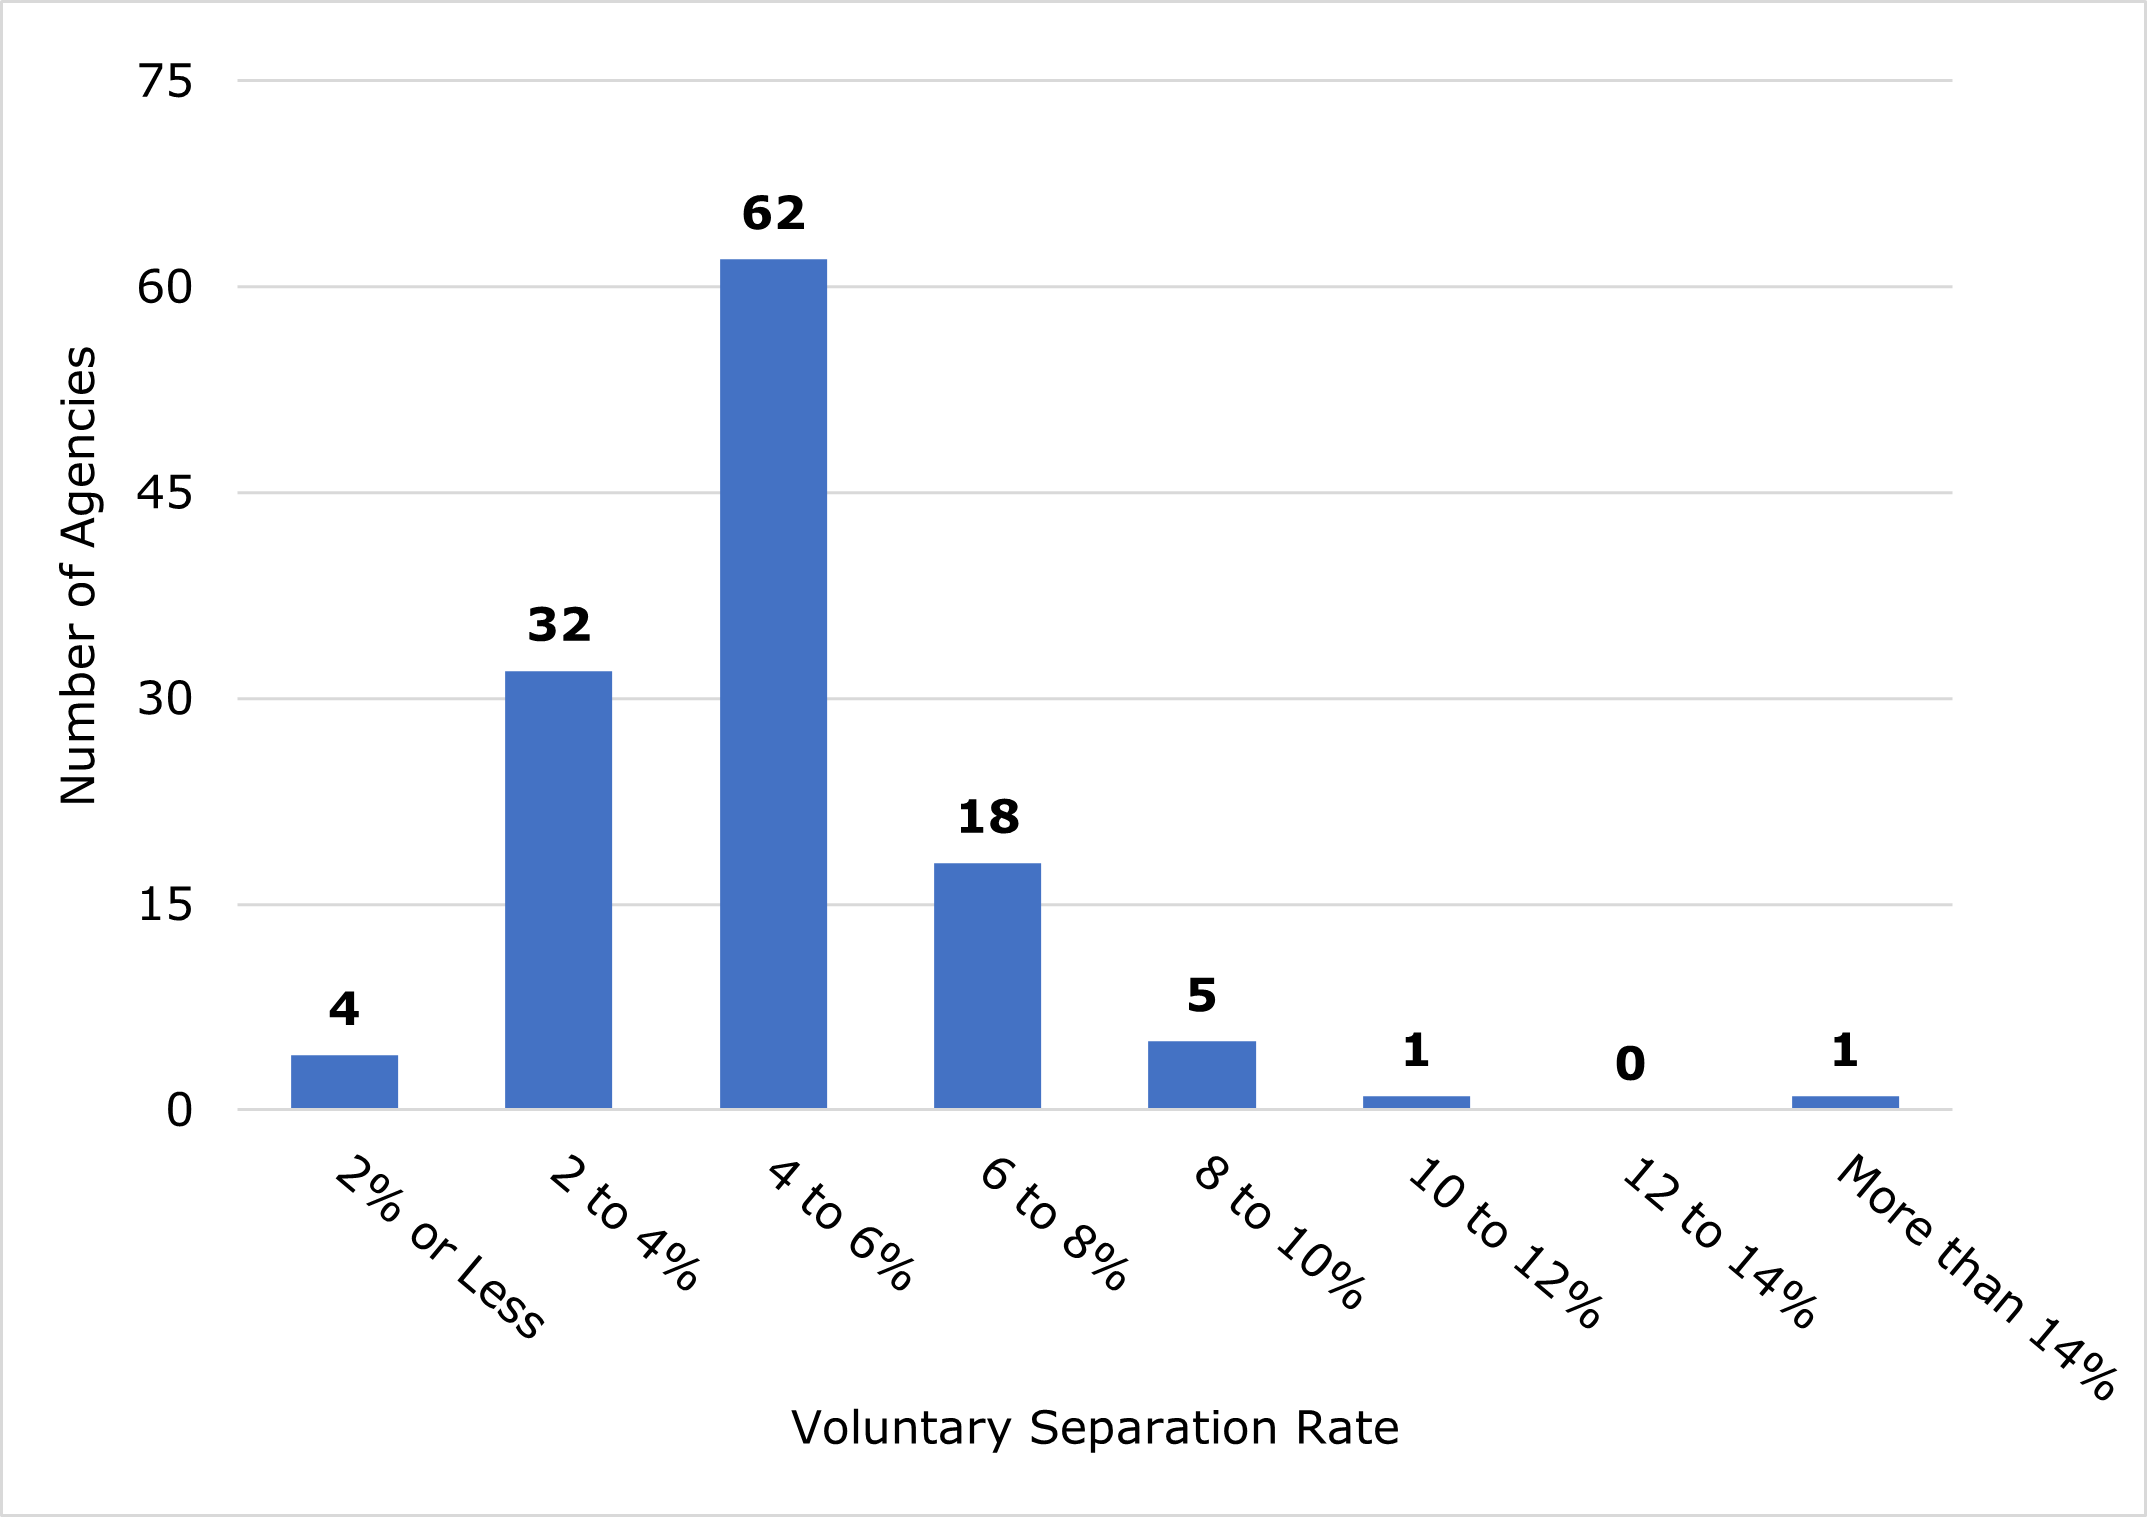
At the average agency, 4.9 percent of persons with no disability voluntarily left in FY 2020. Figure 3 and Table 4 in Appendix A show that the PWOD voluntary separation rates at over 91 percent of agencies were between 2 percent and 8 percent—32 agencies had a PWOD voluntary separation rate between 2 percent and 4 percent, 62 agencies between 4 percent and 6 percent, and 18 agencies between 6 percent and 8 percent. Four agencies had PWOD voluntary separation rates of 2 percent or less. At the opposite extreme, one small agency (with only 36 employees) had a PWOD voluntary separation rate of 16.1 percent.
Figure 3. Voluntary Separation Rates for Persons without Disabilities at Federal Agencies, FY 2020
| PWOD Voluntary Separation Rate | Number of Agencies |
|---|---|
| 2 Percent or Less | 4 |
| 2 to 4 Percent | 32 |
| 4 to 6 Percent | 62 |
| 6 to 8 Percent | 18 |
| 8 to 10 Percent | 5 |
| 10 to 12 Percent | 1 |
| 12 to 14 Percent | 0 |
| More than 14 Percent | 1 |
Notes: PWOD = Persons without disabilities. Data only include permanent employees. Excludes persons with a “Not Identified” disability status. Voluntary separations include separations resulting from resignation and retirement. Voluntary separation rates for PWOD were calculated by dividing the number of voluntary separations of PWOD by the number of PWOD.
Source: U.S. Equal Employment Opportunity Commission, FY 2020 Management Directive 715, Workforce Table B1.
Part G Responses
In FY 2018, the average agency in the dataset answered “Yes” to 89.2 percent of the Part G questions. That value was 87.5 percent in FY 2019 and 89.32 percent in FY 2020. Changes in these averages across years may be due to changes in policies, practices, and procedures. Changes in which agencies filed and certified MD-715 Reports and changes in the interpretation of Part G questions may also cause this average to fluctuate.
Promising Practices to Retain PWD: Regression Results
Of the 468 explanatory variables of interest, each representing one Part G question for one year, four variables were significantly associated with fewer voluntary separations of PWD in FY 2020 (after accounting for the number of PWD and the PWOD voluntary separation rate):
- FY 2020 C.2.b: Has the agency established disability reasonable accommodation (RA) procedures that comply with EEOC’s regulations and guidance?
- FY 2019 C.2.c.1: Does the agency post its procedures for processing requests for personal assistance services (PAS) on its public website?
- FY 2020 C.2.c: Has the agency established procedures for processing requests for PAS that comply with EEOC's regulations, enforcement guidance, and other applicable executive orders, guidance, and standards?
- FY 2020 C.2.c.1: Does the agency post its procedures for processing requests for PAS on its public website?
RA includes making facilities accessible to PWD and “job restructuring, part-time or modified work schedules, reassignment to a vacant position, acquisition or modification of equipment or devices, appropriate adjustment or modifications of examinations, training materials or policies, the provision of qualified readers or interpreters, and other similar accommodations for [PWD].”[30] EEOC regulations require that agencies’ RA procedures be made available in accessible formats to all applicants and employees, that agencies ensure that requests for RA are not denied due to cost, and that those denied RA are notified of the reason and their rights.[31]
PAS are services provided to PWTD who need assistance with “performing activities of daily living that an individual would typically perform if they did not have a disability, and that is not otherwise required as a reasonable accommodation.” This includes assistance with removing and putting on clothing, eating, and using the restroom.[32] The EEOC’s 2017 amendments to the regulations implementing Section 501 of the Rehabilitation Act of 1973 require Federal agencies to provide PAS to certain employees as a form of affirmative action.
Agencies with higher retention of PWD in FY 2020 had compliant RA procedures as of FY 2020, had compliant PAS request processing procedures as of FY 2020 or had their PAS procedures on their public websites as of FY 2019 or FY 2020. This shows the efficacy of EEOC regulations, including the 2017 regulatory updates requiring that Federal agencies provide PAS to persons with disabilities.
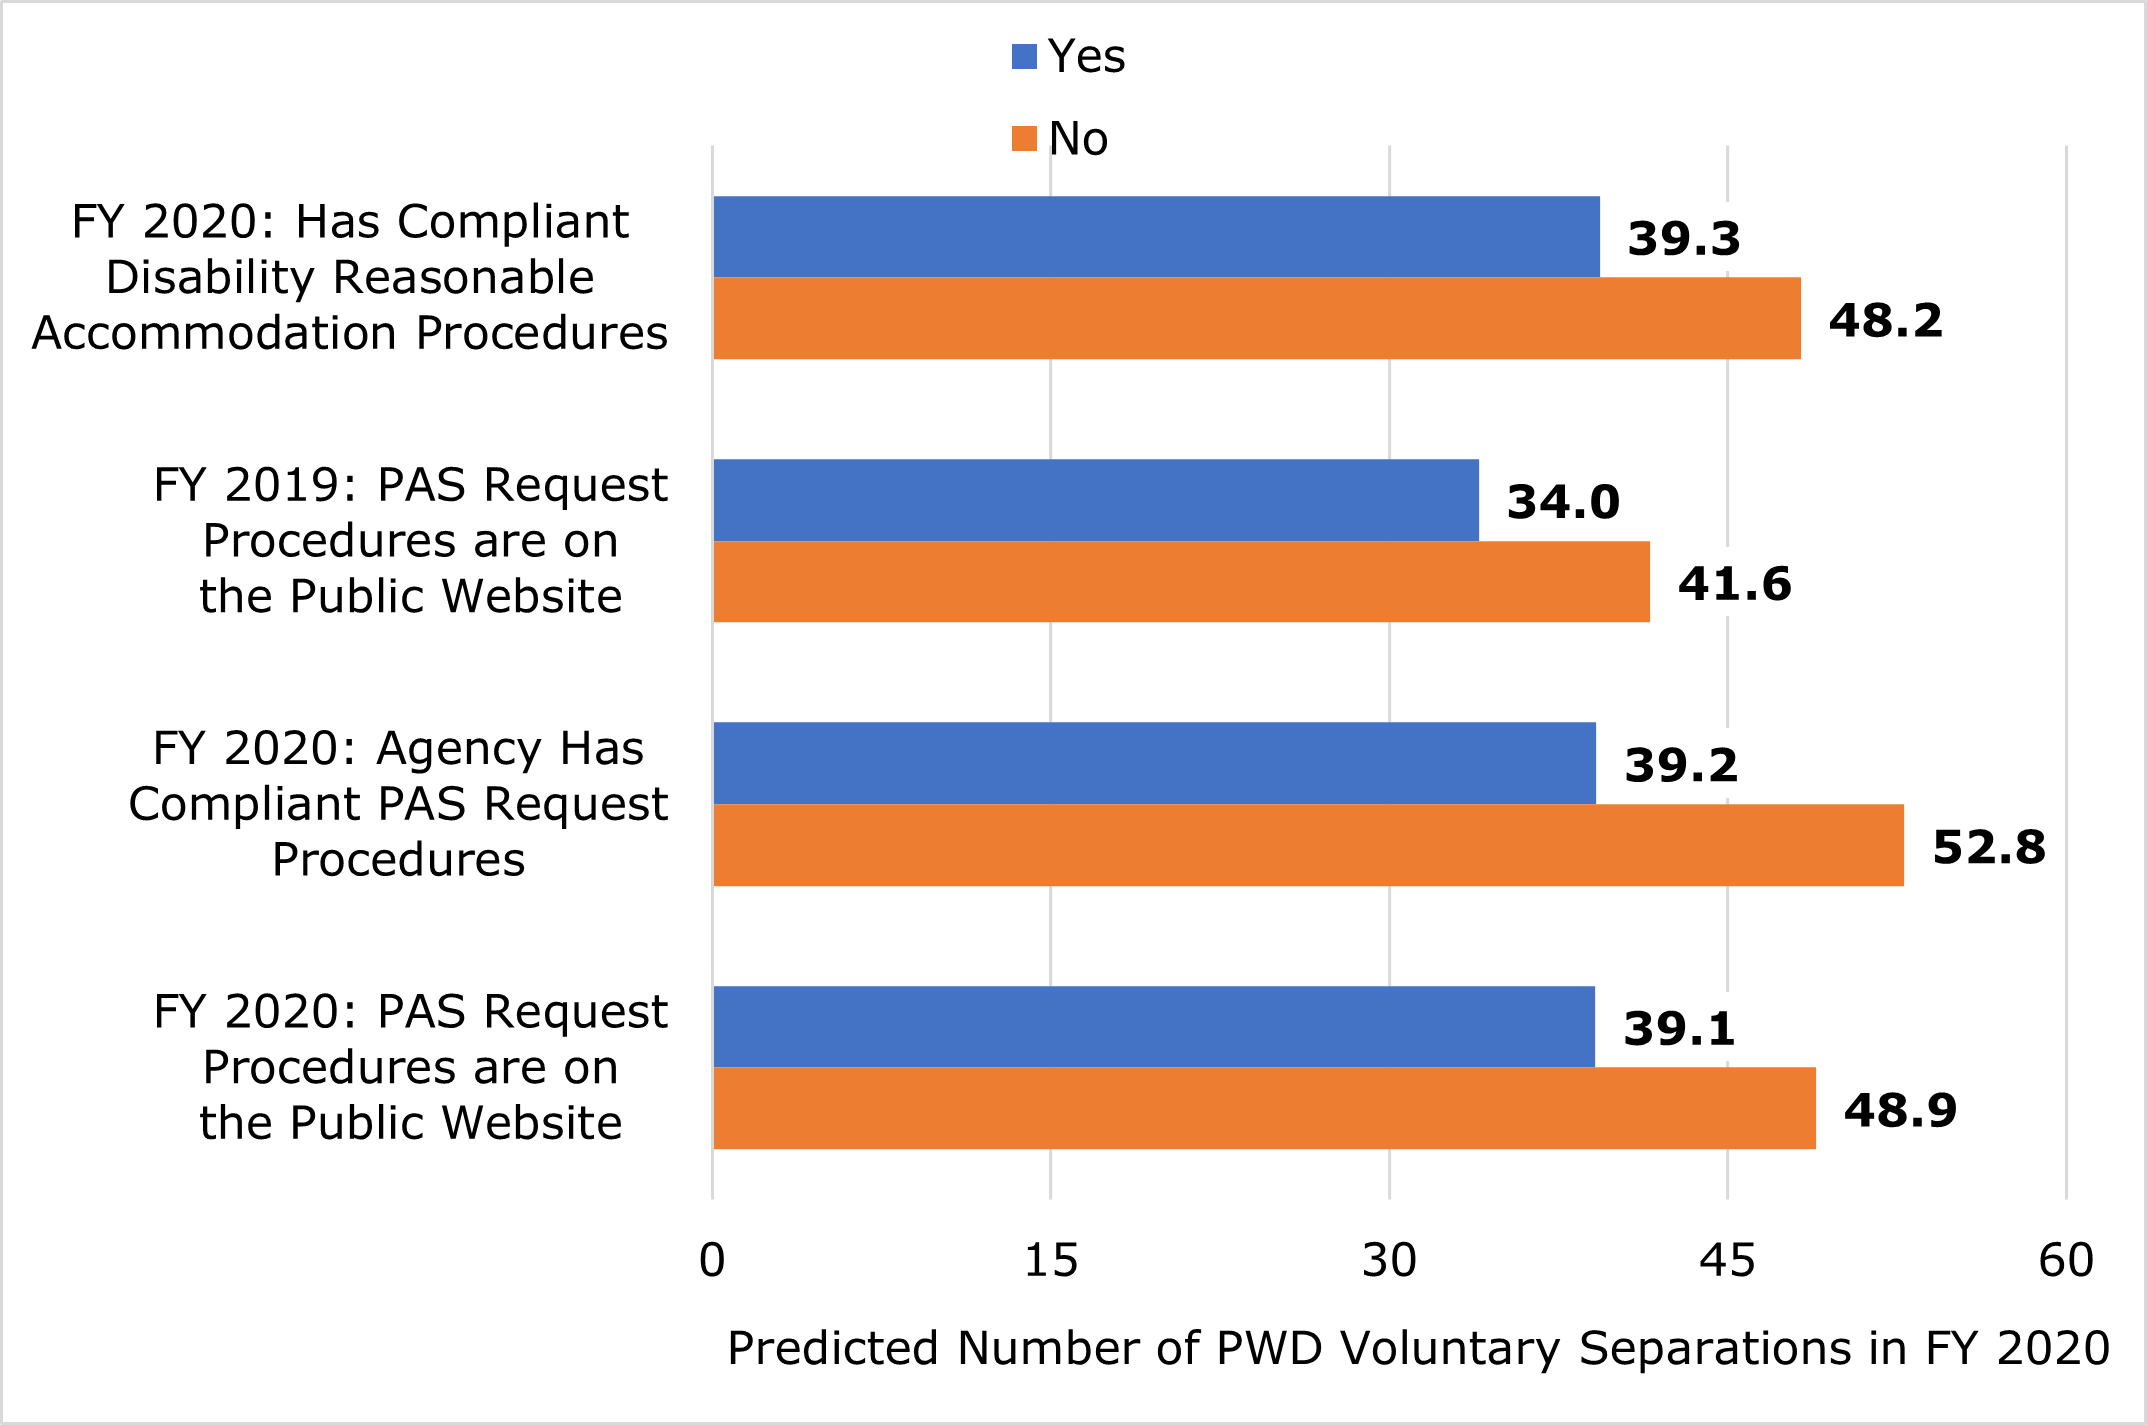
Figure 4 shows the predicted number of PWD voluntary separations from the average agency’s permanent workforce in FY 2020 for each relevant Part G question. The lower the predicted voluntary separations, the higher the retention. These values accounted for the number of PWD in the permanent workforce and the PWOD voluntary separation rate.
Figure 4. Predicted PWD Voluntary Separations at Federal Agencies in FY 2020, by Selected MD-715 Part G Questions
| Predicted Number of PWD Voluntary Separations in FY 2020 | ||
|---|---|---|
| FY 2020 C.2.b: Has Compliant Disability Reasonable Accommodation Procedures | 39.3% Yes | 48.2% no |
| FY 2019 C.2.c.1: PAS Request Processing Procedures on Public Website | 34.0 Yes | 41.6 No |
| FY 2020 C.2.c: Compliant PAS Request Processing Procedures | 39.2 Yes | 52.8 No |
| FY 2020 C.2.c.1: PAS Request Processing Procedures on Public Website | 39.1 Yes | 48.9 No |
Notes: PWD = Persons with Disabilities. PAS = Personal Assistance Services. Voluntary separations include separations resulting from resignation and retirement. The predicted number of PWD voluntary separations accounts for the number of persons with disabilities and the voluntary separation rate of persons without disabilities. Workforce and voluntary separations values are based on the permanent workforce.
Source: U.S. Equal Employment Opportunity Commission, FY 2019–20 Management Directive 715, Part G and Workforce Table B1.
Another way to interpret the results is with average marginal effects—the predicted percent difference in PWD voluntary separations when these Part G questions are answered with a “Yes.” Table 1 shows that, in FY 2020, on average there were 18.5 percent fewer PWD voluntary separations at agencies with compliant RA procedures as of FY 2020. There were 18.3 percent fewer PWD voluntary separations as of FY 2020 at agencies with PAS request processing procedures on their public websites in FY 2019. Having compliant FY 2020 PAS request procedures (25.8 percent) or having PAS request processing procedures on the public website as of FY 2020 (20.0 percent) were also associated with fewer FY 2020 PWD voluntary separations.
Table 1. Statistical Results for Promising Practices to Retain PWD in Federal Agencies in FY 2020
| Part G Practice | Percent Difference in Predicted PWD Separations if “Yes” | Predicted PWD Separations if “Yes” | Predicted PWD Separations if “No” | Percent of Agencies Responding “Yes” | Negative Binomial Regression Coefficient |
|---|---|---|---|---|---|
| FY 2020 C.2.b: Has Compliant Disability Reasonable Accommodation Procedures | -18.5% | 39.3 | 48.2 | 89.4% | -0.205 |
| FY 2019 C.2.c.1: PAS Request Processing Procedures on Public Website | -18.3% | 34.0 | 41.6 | 73.7% | -0.202 |
| FY 2020 C.2.c: Compliant PAS Request Processing Procedures | -25.8% | 39.2 | 52.8 | 91.9% | -0.299 |
| FY 2020 C.2.c.1: PAS Request Processing Procedures on Public Website | -20.0% | 39.1 | 48.9 | 86.2% | -0.223 |
Notes: PWD = Persons with disabilities. PAS = Personal assistance services. This table lists all FY 2018-20 Part G practices that had statistically significant and negative coefficients when predicting the number of PWD voluntary separations in FY 2020. This accounted for the number of PWD and the voluntary separation rate of persons without disabilities. All workforce values are for permanent employees. A coefficient is a statistical estimate that quantifies the strength and direction of the relationship between the outcome variable and the corresponding explanatory variable. The statistical significance of a coefficient is based on the probability that the coefficient is truly equal to zero. Coefficients were considered statistically significant when there was less than a 5 percent chance that they were truly equal to zero.
Source: U.S. Equal Employment Opportunity Commission, FY 2019–20 Management Directive 715, Part G and Workforce Table B1.
These results suggest that agencies with high PWD voluntary separations should ensure that they have compliant RA and PAS request processing procedures and that the PAS request processing procedures are posted on their public websites. Access to RA and PAS and knowing that these services exist may improve PWD retention by reducing barriers to success PWD face in the workplace.[33] Having access to RA and PAS may improve PWD’s dedication, dependability, productivity, morale, and tenure.[34] PWTD requiring PAS may be more likely to stay in the workforce if their employer offers PAS. Furthermore, providing PAS and increasing PWD retention may show all employees that the agency is committed to employment equity for PWD and may improve the workplace climate for PWD. These positive outcomes may improve inclusion, and therefore, PWD’s commitment to working at the agency.
Having compliant PAS request processing procedures in place and publicized as of 2018 might not have improved retention because it was the first full FY that agencies were required to provide PAS. Consequently, PAS programs may not have been fully developed and, therefore, not yet able to influence PWD retention.
Recommendations
The potentially promising practices that were most associated with the retention of PWD involved RA and PAS. PWD who require RA or PAS may be more likely to be able to enter and stay in the workforce when employers provide these services. This may prevent early retirement due to disability. Furthermore, agencies that demonstrate commitment to employing PWD who require RA or PAS may also be perceived as more inclusive to all PWD. This may prevent resignations.
The EEOC found that PWD voluntarily separated less often in FY 2020 at agencies where compliant RA procedures and PAS request processing procedures were in place as of FY 2020. In addition, the EEOC found that agencies that posted their PAS request processing procedures on their public websites as of FY 2019 or 2020 had fewer PWD voluntary separations in FY 2020. This suggests that having and promoting compliant RA procedures and PAS request processing procedures may improve retention for PWD. Thus, the EEOC recommends that agencies ensure they have:
- Established compliant RA procedures as required by regulations.
- Established compliant procedures for processing PAS requests as required by regulations.
- Procedures for processing PAS requests publicized to their employees and applicants on their public websites, as required by regulations.
The recommendations above are particularly important for agencies where PWD voluntarily separate at higher rates than PWOD.
Persons requiring RA or PAS may be more likely to stay in the labor force when their employers provide RA or PAS, regardless of the employment sector. The EEOC analysis suggests that employers nationwide that provide RA and PAS to their employees may improve employment opportunities and workplace inclusion for PWD.
Conclusion
Previous EEOC research established that PWD separate from Federal employment at a higher rate than PWOD.[35] This contributes to Federal agencies failing to meet their goal of a 12 percent participation rate for PWD. The EEOC examined ways to improve PWD retention. The EEOC explored the relationship between PWD voluntary separations in FY 2020 and the implementation of 156 agency-level potentially promising practices across three years, FYs 2018, 2019, and 2020.
The results showed that Federal agencies that had compliant RA procedures, had compliant PAS request processing procedures, and had their PAS request procedures posted on their public websites had fewer PWD voluntary separations. This accounted for the number of PWD at the agency and the PWOD voluntary separation rate. Based on these findings, the EEOC recommends that Federal employers focus on providing RA and PAS to their employees to improve retention of PWD and overall inclusion.
Next Steps
This report is one of few so far to quantitatively examine the relationship between the retention of PWD and specific employer policies, procedures, and practices. Specifically, 156 potentially promising practices were examined over three years. By identifying the most promising practices for the retention of PWD this report empirically identified specific actions for employers to take to improve PWD retention.
The methodology used here, examining a multitude of practices’ effects, may be useful for identifying promising practices because many potentially promising practices have not been tested for efficacy. This report found three practices significantly associated with better FY 2020 PWD retention: having complaint RA procedures as of FY 2020, compliant PAS request processing procedures as of FY 2020, and PAS request processing procedures on public websites as of FY 2019 or FY 2020.
Recently, the EEOC conducted a program evaluation on PAS programs. The majority of Federal agencies surveyed in that evaluation cited sufficient funding (68.8 percent) and staffing (66.7 percent) as key factors for having a successful PAS program.[36] Agencies should consider these factors as they implement and improve their PAS programs.
Equitable PWD retention is only one employment outcome required for EEO. Other MD-715 Part G promising practices may be important for improving other measures of EEO. If potentially promising practices do not empirically improve EEO, the EEOC may consider this in any revisions to MD-715 reporting requirements.
To achieve equity in the Federal workforce, agencies should continue to strive to retain PWD. As this report shows, having compliant RA procedures and PAS request processing procedures are key to achieving this goal. The EEOC will continue to identify and promote promising practices to help employers create more equitable workplaces for PWD and all segments of society.
Appendix A: Descriptive Statistics
Table 2. Distribution of Voluntary Separations of Persons with Disabilities at Federal Agencies, FY 2020
| Voluntary Separations | Number of Agencies |
|---|---|
| 0 to 5 | 42 |
| 6 to 10 | 18 |
| 11 to 20 | 14 |
| 21 to 30 | 4 |
| 31 to 40 | 13 |
| 41 to 50 | 8 |
| 51 to 60 | 7 |
| 61 to 70 | 2 |
| 71 to 80 | 1 |
| 81 to 90 | 0 |
| 91 to 100 | 2 |
| More than 100 | 12 |
Note: Only includes permanent employees.
Source: U.S. Equal Employment Opportunity Commission, FY 2020 Management Directive 715, Workforce Table B1.
Table 3. Distribution of Persons with Disabilities at Federal Agencies, FY 2020
| Number of Persons with Disabilities | Number of Agencies |
|---|---|
| 0 to 100 | 44 |
| 101 to 200 | 14 |
| 201 to 300 | 7 |
| 301 to 400 | 11 |
| 401 to 500 | 8 |
| 501 to 600 | 4 |
| 601 to 700 | 0 |
| 701 to 800 | 7 |
| 801 to 900 | 4 |
| 901 to 1,000 | 2 |
| More than 1,000 | 22 |
Note: Only includes permanent employees.
Source: U.S. Equal Employment Opportunity Commission, FY 2020 Management Directive 715, Workforce Table B1.
Table 4. Distribution of Voluntary Separation Rates for Persons without Disabilities at Federal Agencies, FY 2020
| PWOD Voluntary Separation Rate | Number of Agencies |
|---|---|
| 2 Percent or Less | 4 |
| 2 to 4 Percent | 32 |
| 4 to 6 Percent | 62 |
| 6 to 8 Percent | 18 |
| 8 to 10 Percent | 5 |
| 10 to 12 Percent | 1 |
| 12 to 14 Percent | 0 |
| More than 14 Percent | 1 |
Notes: PWOD = Persons without disabilities. Only includes permanent employees. Excludes persons with a “Not Identified” disability status. PWOD voluntary separation rates are calculated by dividing the number of voluntary separations of PWOD by the number of PWOD.
Source: U.S. Equal Employment Opportunity Commission, FY 2020 Management Directive 715, Workforce Table B1.
Appendix B: Regression Results for Part G Practices
Table 5. Negative Binomial Regression Results Predicting FY 2020 PWD Voluntary Separations Regressed on Compliant Disability Reasonable Accommodation Procedures as of FY 2020
| Variable | Coef. | S.E. of Coef. | z | p-value | Sig. |
|---|---|---|---|---|---|
| Has Compliant Disability Reasonable Accommodation Procedures in FY 2020 | -0.205 | 0.084 | -2.440 | 0.015 | * |
| PWOD Voluntary Separation Rate | 10.869 | 2.087 | 5.210 | 0.000 | *** |
| Intercept | -3.204 | 0.120 | -26.640 | 0.000 | *** |
Notes: Results based on 123 observations. PWD = Persons with disabilities. PWOD = Persons without disabilities. Coef. = Coefficient. S.E. = Standard error. z = z-statistic. Statistical significance levels (Sig.): *** p < 0.001; ** p < 0.01; * p < 0.05. A coefficient is a statistical estimate that quantifies the strength and direction of the relationship between the outcome variable and the corresponding explanatory variable. The standard error is a measure of the accuracy of a statistical estimate, such as a coefficient. The coefficient divided by the standard error provides the z-statistic, which is used to calculate the p-value and the level of statistical significance. The statistical significance of a coefficient is based on the probability that the coefficient is truly equal to zero. A coefficient is statistically significant when the p-value is less than 0.05. The intercept is the predicted number of PWD voluntary separations (transformed with a natural logarithm) when all predictor variables equal zero. The number of PWD in the permanent workforce was included in the regression model as an exposure variable which accounts for the number of chances that there were for a PWD to separate. Data only include permanent employees and exclude persons with a “Not Identified” disability status. PWOD voluntary separation rates are calculated by dividing the number of voluntary separations of PWOD by the number of PWOD.
Source: U.S. Equal Employment Opportunity Commission, FY 2020 Management Directive 715, Part G and Workforce Table B1.
Table 6. Negative Binomial Regression Results Predicting FY 2020 PWD Voluntary Separations Regressed on PAS Request Processing Procedures Being on an Agency’s Public Website as of FY 2019
| Variable | Coef. | S.E. of Coef. | z | p-value | Sig. |
|---|---|---|---|---|---|
| PAS Request Processing Procedures on Public Website in FY 2019 | -0.202 | 0.098 | -2.060 | 0.039 | * |
| PWOD Voluntary Separation Rate | 6.850 | 3.182 | 2.150 | 0.031 | * |
| Intercept | -3.032 | 0.158 | -19.180 | 0.000 | *** |
Notes: Results based on 76 observations. PWD = Persons with disabilities. PAS = Personal assistance services. PWOD = Persons without disabilities. Coef. = Coefficient. S.E. = Standard error. z = z-statistic. Statistical significance levels (Sig.): *** p < 0.001; ** p < 0.01; * p < 0.05. A coefficient is a statistical estimate that quantifies the strength and direction of the relationship between the outcome variable and the corresponding explanatory variable. The standard error is a measure of the accuracy of a statistical estimate, such as a coefficient. The coefficient divided by the standard error provides the z-statistic, which is used to calculate the p-value and the level of statistical significance. The statistical significance of a coefficient is based on the probability that the coefficient is truly equal to zero. A coefficient is statistically significant when the p-value is less than 0.05. The intercept is the predicted number of PWD voluntary separations (transformed with a natural logarithm) when all predictor variables equal zero. The number of PWD in the permanent workforce was included in the regression model as an exposure variable which accounts for the number of chances that there were for a PWD to separate. Data only include permanent employees and exclude persons with a “Not Identified” disability status. PWOD voluntary separation rates are calculated by dividing the number of voluntary separations of PWOD by the number of PWOD.
Source: U.S. Equal Employment Opportunity Commission, FY 2019–20 Management Directive 715, Part G and Workforce Table B1.
Table 7. Negative Binomial Regression Results Predicting FY 2020 PWD Voluntary Separations Regressed on Compliant PAS Request Processing Procedures as of FY 2020
| Variable | Coef. | S.E. of Coef. | z | p-value | Sig. |
|---|---|---|---|---|---|
| Compliant PAS Request Processing Procedures in FY 2020 | -0.299 | 0.092 | -3.250 | 0.001 | ** |
| PWOD Voluntary Separation Rate | 11.645 | 2.081 | 5.600 | 0.000 | *** |
| Intercept | -3.151 | 0.119 | -26.400 | 0.000 | *** |
Notes: Results based on 123 observations. PWD = Persons with disabilities. PAS = Personal assistance services. PWOD = Persons without disabilities. Coef. = Coefficient. S.E. = Standard error. z = z-statistic. Statistical significance levels (Sig.): *** p < 0.001; ** p < 0.01; * p < 0.05. A coefficient is a statistical estimate that quantifies the strength and direction of the relationship between the outcome variable and the corresponding explanatory variable. The standard error is a measure of the accuracy of a statistical estimate, such as a coefficient. The coefficient divided by the standard error provides the z-statistic, which is used to calculate the p-value and the level of statistical significance. The statistical significance of a coefficient is based on the probability that the coefficient is truly equal to zero. A coefficient is statistically significant when the p-value is less than 0.05. The intercept is the predicted number of PWD voluntary separations (transformed with a natural logarithm) when all predictor variables equal zero. The number of PWD in the permanent workforce was included in the regression model as an exposure variable which accounts for the number of chances that there were for a PWD to separate. Data only include permanent employees and exclude persons with a “Not Identified” disability status. PWOD voluntary separation rates are calculated by dividing the number of voluntary separations of PWOD by the number of PWOD.
Source: U.S. Equal Employment Opportunity Commission, FY 2020 Management Directive 715, Part G and Workforce Table B1.
Table 8. Negative Binomial Regression Results Predicting FY 2020 PWD Voluntary Separations Regressed on PAS Request Processing Procedures Being on an Agency’s Public Website as of FY 2020
| Variable | Coef. | S.E. of Coef. | z | p-value | Sig. |
|---|---|---|---|---|---|
| PAS Request Processing Procedures on Public Website in FY 2020 | -0.223 | 0.082 | -2.700 | 0.007 | ** |
| PWOD Voluntary Separation Rate | 11.809 | 2.152 | 5.490 | 0.000 | *** |
| Intercept | -3.236 | 0.112 | -28.850 | 0.000 | *** |
Notes: Results based on 123 observations. PWD = Persons with disabilities. PAS = Personal assistance services. PWOD = Persons without disabilities. Coef. = Coefficient. S.E. = Standard error. z = z-statistic. Statistical significance levels (Sig.): *** p < 0.001; ** p < 0.01; * p < 0.05. A coefficient is a statistical estimate that quantifies the strength and direction of the relationship between the outcome variable and the corresponding explanatory variable. The standard error is a measure of the accuracy of a statistical estimate, such as a coefficient. The coefficient divided by the standard error provides the z-statistic, which is used to calculate the p-value and the level of statistical significance. The statistical significance of a coefficient is based on the probability that the coefficient is truly equal to zero. A coefficient is statistically significant when the p-value is less than 0.05. The intercept is the predicted number of PWD voluntary separations (transformed with a natural logarithm) when all predictor variables equal zero. The number of PWD in the permanent workforce was included in the regression model as an exposure variable which accounts for the number of chances that there were for a PWD to separate. Data only include permanent employees and exclude persons with a “Not Identified” disability status. PWOD voluntary separation rates are calculated by dividing the number of voluntary separations of PWOD by the number of PWOD.
Source: U.S. Equal Employment Opportunity Commission, FY 2020 Management Directive 715, Part G and Workforce Table B1.
[1] U.S. Equal Employment Opportunity Commission. (2017). Questions & answers: The EEOC’s final rule on affirmative action for people with disabilities in Federal employment. https://www.eeoc.gov/laws/guidance/questions-answers-eeocs-final-rule-affirmative-action-people-disabilities-federal.
[2] U.S. Equal Employment Opportunity Commission. (2022). The EEO status of workers with disabilities in the Federal sector. https://www.eeoc.gov/federal-sector/reports/eeo-status-workers-disabilities-federal-sector.
[3] PAS are services provided to persons with targeted disabilities who need assistance with “performing activities of daily living that an individual would typically perform if [they] did not have a disability.” This includes assistance with removing and putting on clothing, eating, and using the restroom. See https://www.eeoc.gov/laws/guidance/questions-answers-federal-agencies-obligation-provide-personal-assistance-services.
[4] The Rehabilitation Act of 1973. 29 U.S.C. §§ 701–797 (2010). https://www.govinfo.gov/content/pkg/USCODE-2010-title29/pdf/USCODE-2010-title29-chap16.pdf.
[5] See the Rehabilitation Act of 1973. 29 U.S.C. §§ 701–797 (2010); Civil Rights Act of 1964. 42 U.S.C. § 2000e–16(b) (1964). https://www.govinfo.gov/content/pkg/USCODE-2020-title42/pdf/USCODE-2020-title42-chap21-subchapVI-sec2000e-16.pdf; and Title VII of the Civil Rights Act of 1964. https://www.eeoc.gov/statutes/title-vii-civil-rights-act-1964.
[6] The Rehabilitation Act of 1973 (Original Text). https://www.eeoc.gov/rehabilitation-act-1973-original-text.
[7] Executive Order No. 13548, 75 Fed. Reg. 45039 (July 30, 2010). https://www.govinfo.gov/content/pkg/DCPD-201000631/pdf/DCPD-201000631.pdf.
[8] U.S. Equal Employment Opportunity Commission. (2017). Questions & answers: The EEOC’s final rule on affirmative action for people with disabilities in Federal employment. https://www.eeoc.gov/laws/guidance/questions-answers-eeocs-final-rule-affirmative-action-people-disabilities-federal.
[9] Chordiya, R. (2020). Organization inclusion and turnover intentions of Federal employees with disabilities. Review of Public Personnel Administration (Online), July 2020. https://journals.sagepub.com/doi/10.1177/0734371X20942305.
[10] U.S. Government Accountability Office. (2020). Disability employment: Hiring has increased but actions needed to assess retention, training, and reasonable accommodation efforts. https://www.gao.gov/assets/710/707504.pdf.
[11] U.S. Equal Employment Opportunity Commission. (2022). The EEO status of workers with disabilities in the Federal sector. https://www.eeoc.gov/federal-sector/reports/eeo-status-workers-disabilities-federal-sector.
[12] U.S. Government Accountability Office. (2010). Participant-identified leading practices that could increase the employment of individuals with disabilities in the Federal workforce. https://www.gao.gov/assets/210/204277.pdf. U.S. Government Accountability Office. (2012). Disability employment: Further action needed to oversee efforts to meet Federal government hiring goals. https://www.gao.gov/assets/600/591134.pdf.
[13] Employer Assistance and Resource Network on Disability Inclusion. (2020). The relationship between Federal agency disability practices and employee outcomes. https://askearn.org/wp-content/uploads/2020/12/EARN-2020-Relationship_Betw_Fed_Agency_Practice_and_Emply_Outcomes.pdf.
[14] U.S. Equal Employment Opportunity Commission. (2017). Questions & answers: The EEOC’s final rule on affirmative action for people with disabilities in Federal employment. https://www.eeoc.gov/laws/guidance/questions-answers-eeocs-final-rule-affirmative-action-people-disabilities-federal.
[15] U.S. Equal Employment Opportunity Commission. (2022). The EEO status of workers with disabilities in the Federal sector. https://www.eeoc.gov/federal-sector/reports/eeo-status-workers-disabilities-federal-sector.
[16] Workforce Data Table B-1 (Total Workforce – Distribution by Disability Status [Participation Rate]).
[17] For the full checklist, see https://www.eeoc.gov/federal-sector/management-directive/md-715-part-g-agency-self-assessment-checklist.
[18] The voluntary separation rate of PWOD was calculated by dividing the number of voluntary separations of PWOD from the permanent workforce by the number of PWOD in the permanent workforce. PWOD only included persons who reported having “No Disability” and did not include “Not Identified.”
[19] U.S. Equal Employment Opportunity Commission. (2003). Section 717 of Title VII: Equal Employment Opportunity Management Directive 715. https://www.eeoc.gov/federal-sector/management-directive/section-717-title-vii.
[20] Analyzing each Part G question separately was necessary because the Part G responses were collinear. Collinearity occurs when two or more predictor variables are highly correlated. For example, in the data, agencies that responded “Yes” to one Part G questions were much more likely to answer “Yes” to other Part G questions. Collinearity between predictor variables results in inaccurate results when determining statistical significance.
[21] Two agencies had more than 1,000 PWD voluntary separations: The Department of Defense (DOD) Army and Air Force Exchange Service (1,721 PWD voluntary separations) and the U.S. Postal Service (2,116 PWD separations). The two agencies with the next most PWD voluntary separations had 465 and 679 PWD separations. Two agencies had a PWOD voluntary separation rate greater than 40 percent: the DOD Army and Air Force Exchange Service (55.2 percent) and the Office of Navajo and Hopi Indian Relocation (55.6 percent). The next largest PWOD voluntary separation rate was 16.1 percent. These agencies were excluded from analyses because these extreme values (or outliers) may bias the results. Additional analyses showed that the conclusions drawn would still apply if outliers were included, but additional promising practices would also be statistically significant.
[22] Separations from subcomponent agencies are counted in both the subcomponent and the parent agency’s report. Therefore, reports from subcomponents and parent agencies could not both be used.
[23] For more information, see UCLA Advanced Research Computing: Statistical Methods and Data Analytics. https://stats.oarc.ucla.edu/stata/dae/negative-binomial-regression.
[24] Count variables are measured with non-negative integer values (0, 1, 2, 3, etc.).
[25] Over-dispersed data have more variation than assumed by the statistical model. In statistical terms, the variance is much greater than the average (mean).
[26] The statistical significance of a coefficient measures the probability (p-value) that the explanatory variable did not have a real, statistically significant relationship with the outcome variable. In this study, a coefficient is statistically significant when the p-value is less than 0.05.
[27] If one sorts a set of values from smallest to largest, the middle value is the median. The median resists the influence of outliers better than the average (mean).
[28] The permanent workforces of these large agencies varied between 8,710 and 77,427.
[29] The permanent workforces of these large agencies varied between 4,852 and 77,427.
[30] Equal Opportunity for Individuals with Disabilities – Definitions, 42 U.S.C. §§ 12111(9). (2024). https://uscode.house.gov/view.xhtml?hl=false&edition=prelim&req=granuleid%3AUSC-prelim-title42-chapter126-subchapter1&num=0&saved=%7CZ3JhbnVsZWlkOlVTQy1wcmVsaW0tdGl0bGU0Mi1zZWN0aW9uMTIxMDE%3D%7C%7C%7C0%7Cfalse%7Cprelim.
[31] Rehabilitation Act. 29 C.F.R. §1614.203 (d)(3). (2023). https://www.govinfo.gov/content/pkg/CFR-2023-title29-vol4/pdf/CFR-2023-title29-vol4-sec1614-203.pdf.
[32] U.S. Equal Employment Opportunity Commission. (2017). Questions & answers: Federal agencies’ obligation to provide personal assistance services under Section 501 of the Rehabilitation Act. EEOC-NVTA-2017-3. https://www.eeoc.gov/laws/guidance/questions-answers-federal-agencies-obligation-provide-personal-assistance-services.
[33] Blanck, P. (2020). Disability inclusive employment and the accommodation principle for people with disabilities. Journal of Occupational Rehabilitation 30, 505–510. https://doi.org/10.1007/s10926-020-09940-9. Solovieva, T. I., Wallsh, R. T., Hendricks, D. J., & Dowler, D. L. (2010). Workplace personal assistance services for people with disabilities: Making productive employment possible. Journal of Rehabilitation, 76(4), 3–8. https://search.ebscohost.com/login.aspx?direct=true&db=aph&AN=58464918&site=ehost-live&scope=site.
[34] Barcus, J. M., & Targett, P. (2003). Maximizing employee effectiveness through use of personal assistance services at the workplace. Journal of Vocational Rehabilitation, 18(2), 99-106. https://content.iospress.com/articles/journal-of-vocational-rehabilitation/jvr00185. Blanck, P. (2020). Disability inclusive employment and the accommodation principle for people with disabilities. Journal of Occupational Rehabilitation 30, 505–510. https://doi.org/10.1007/s10926-020-09940-9.
[35] U.S. Equal Employment Opportunity Commission. (2022). The EEO Status of Workers with Disabilities in the Federal Sector. https://www.eeoc.gov/federal-sector/reports/eeo-status-workers-disabilities-federal-sector.
[36] U.S. Equal Employment Opportunity Commission. (2024). The Impact of Telework on Personal Assistance Services. https://www.eeoc.gov/federal-sector/reports/impact-telework-personal-assistance-services.